
 9 hours ago
1
9 hours ago
1
PROTECT YOUR DNA WITH QUANTUM TECHNOLOGY
Orgo-Life the new way to the future Advertising by Adpathway Rick Scuteri-Imagn Images
Watch this play. What do you notice?
Here’s what I see: Brooks Lee lofts a soft fly ball 248 feet from home plate. Chandler Simpson circles it but loses a bit of momentum by the time it lands in his glove. Twins third base coach Tommy Watkins sends the not-particularly-fast Trevor Larnach (18th-percentile sprint speed). Shallow fly ball, slow runner, close play at the plate — Larnach slides in just ahead of the throw. It’s an exciting sequence, and I’ve missed an important part of it.
During a talk at the Saberseminar conference two Saturdays past, Josh Kalk, an assistant general manager with the Minnesota Twins, went through this same exercise, showing this Lee sacrifice fly, and then asking the audience: What do you notice? He wanted to talk about the play behind the play. Specifically, he wanted to talk about this guy:
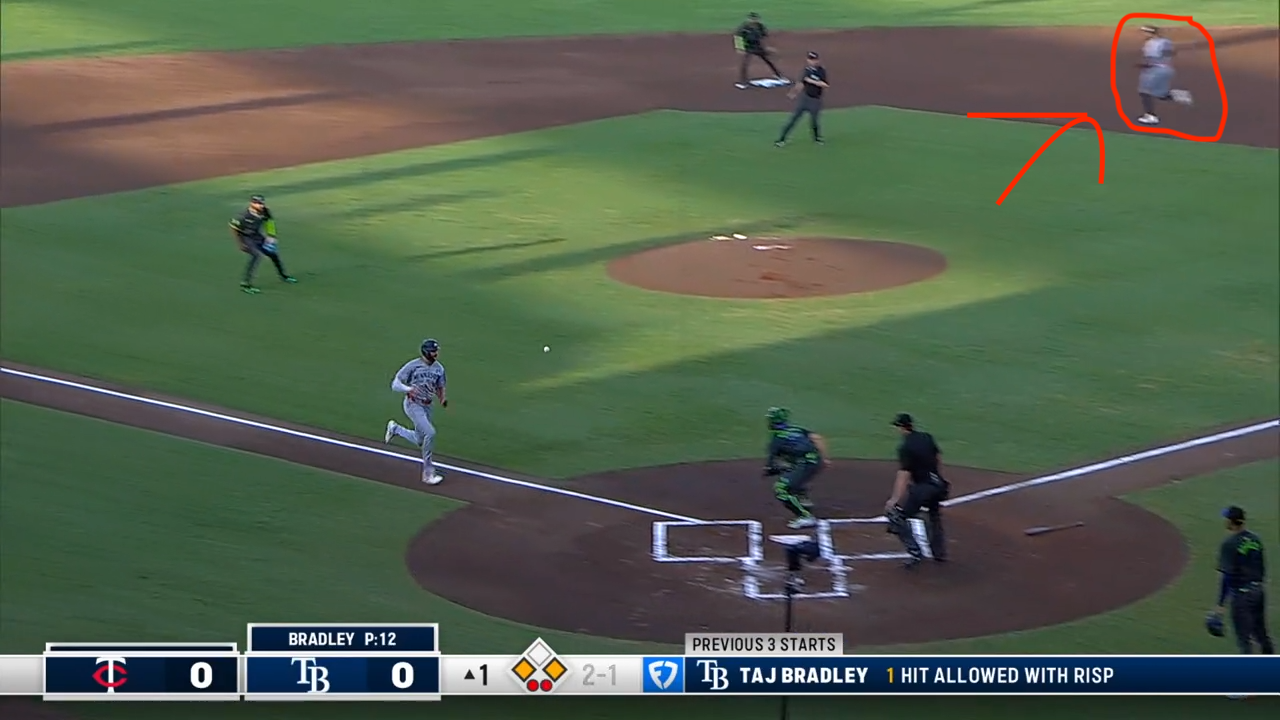
That’s Carlos Correa, reading the throw and scampering off to second base. Whether teams capitalize on these trail runner opportunities, Kalk suggested, matters more than most people realize.
There it was, a perfect post idea presented on a platter. How often do teams take advantage of potential trail runner advances? Which teams do it best? And what sort of impact are we talking about here?
I figured the differences between teams would be marginal at best. Baserunning margins, even in the broadest sense, are pretty slim. By Statcast’s Baserunning Run Value leaderboard, the spread between the best team (the Brewers) and the worst (the Rockies) is 20 runs, or roughly two wins. (Our analogous BsR statistic sees the gap as roughly the same.) Compared to hitting, pitching, and even fielding, baserunning is sort of the ugly duckling of public baseball analysis, and I think the narrow differences between teams help to explain why.
Another reason: Much of the variation between these teams can be explained by a single obvious variable. In general, fast teams tend to be good baserunning teams. The BsR-leading Brewers, for example, are also the second-fastest team in the majors. The relationship between sprint speed and baserunning value is relatively strong — since the dawn of the Statcast era (2015), there is an r-squared of 0.307 between team sprint speed and a blended version of FanGraphs BsR and Statcast baserunning value:

But even after factoring in sprint speed, there’s still a good chunk of variation to account for. Take the poor Rockies. Their sprint speed is identical to the Brewers’; they also rank dead last in both BsR and Baserunning Run Value. As Juan Soto and Josh Naylor have shown this season, speed isn’t everything when it comes to running the bases with skill. It takes instincts, good reads, split-second decisions, and quality coaching on the corners. It’s more than just zooming from base to base.
Take the Lee sacrifice fly from the lede, where the slow-footed Correa advanced to second on the throw. There is a crucial part of the play where Correa must make the decision to either break for second or stay put at first. It’s right around here, when the third baseman Junior Caminero has to make a similarly difficult split-second decision:
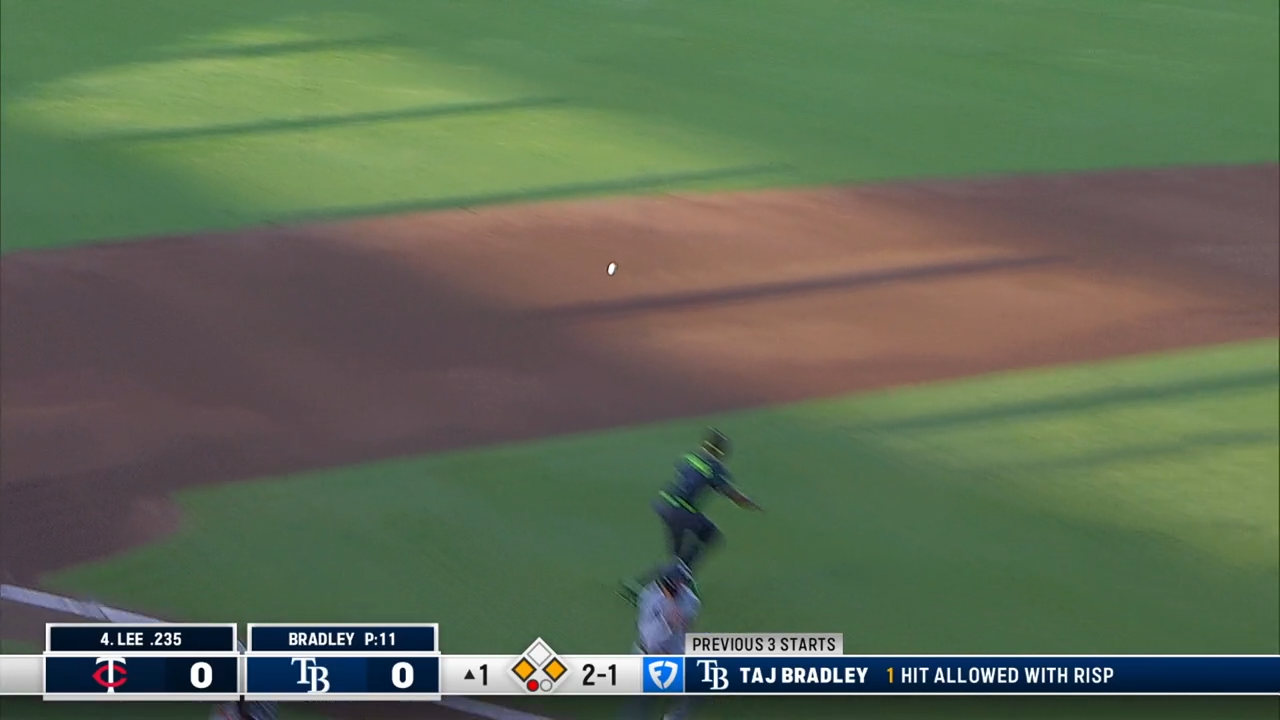
If Caminero cuts off the throw and Correa is hung out in no man’s land, that’s the end of the inning. But he moves his glove at the last second, letting the throw sail home. Given how close the play was at the plate, I think Caminero made the right call. But perhaps even better was Correa’s read — Caminero was in perfect position, and Correa managed to take the base anyway.
Not all trail runner scenarios are this complicated; there are times when even the most oafish of baserunners can coast into second. If it was mostly coasting oafs, you’d expect all teams to exhibit roughly the same skill level. But that doesn’t turn out to be the case.
To gather my data, I relied on the wisdom of the official scorers. There is no easy way to account for trail runners, as I’ve learned rather painfully over the last couple of weeks. Baseball Savant provides a .csv file of every single pitch thrown in the regular season (shout out Baseball Savant), but these data do not include much baserunning information in tabular form — only where the runners started, really, and the identity of said runners. An R function produces the ensuing base state of a given play (thanks to Robert Frey for pointing this out), but there’s no way to determine whether the runner on second got there because he hit a double or because he hit a single and advanced to second as a trail runner.
This also required me to set a clear definition of who, exactly, is a “trail runner.” First, I eliminated all home runs (obviously), triples (since a triple will always clear the bases, and the hitter can’t score without an error), and groundball outs (different kind of situation). That left all singles and doubles with at least one runner on base, as well as all fly balls with at least two runners on base, as possible trail runner scenarios.
For the singles and doubles, I made the perhaps controversial decision to call the batter the trail runner in all cases. My logic was something like: If somebody hit a single up the middle with runners on the corners, the guy on third will score easily in 99% of cases. He’s no longer the defense’s concern. It’s the guy on first who becomes the lead runner, and the defense focuses on preventing his advance, making the batter the trail runner.
The logic was a little different for fly outs. If there was more than one runner on base, I defined the trail runner as the runner furthest from home plate. For example, if the bases were loaded, the trail runner would be on first base. In all cases, though, I limited the number of possible trail runners on a given play to one.
To ascertain these situations, I used the Gameday descriptions. If the Gameday description said the runner singled and then advanced to second, I considered him a trail runner. (An example: “Roman Anthony singles on a groundball to center fielder Jung Hoo Lee. Jarren Duran scores. Roman Anthony to 2nd.”) Same with doubles where the runner advanced to third. Fly ball outs were a little trickier. If the trail runner’s name appeared anywhere in the description, I counted that as a trail runner advance. (If the runner stays put, they’re not mentioned; they’d only appear in the description if they advanced a base or got thrown out, and I eliminated double plays from the dataset.)
As of August 25, by these defined parameters, there had been only 501 trail runner advancements across the entire season. (I’ll admit, that surprised me.) So which teams do it best? And how much does it matter? First, I counted the total number of advancements for each team. Here’s the list:
Trail Runner Advances
| Detroit Tigers | 28 |
| St. Louis Cardinals | 26 |
| Toronto Blue Jays | 25 |
| Miami Marlins | 23 |
| Arizona Diamondbacks | 23 |
| Milwaukee Brewers | 22 |
| Cincinnati Reds | 21 |
| San Diego Padres | 20 |
| Tampa Bay Rays | 20 |
| Chicago Cubs | 19 |
| Boston Red Sox | 18 |
| Los Angeles Dodgers | 18 |
| Cleveland Guardians | 18 |
| San Francisco Giants | 18 |
| Kansas City Royals | 17 |
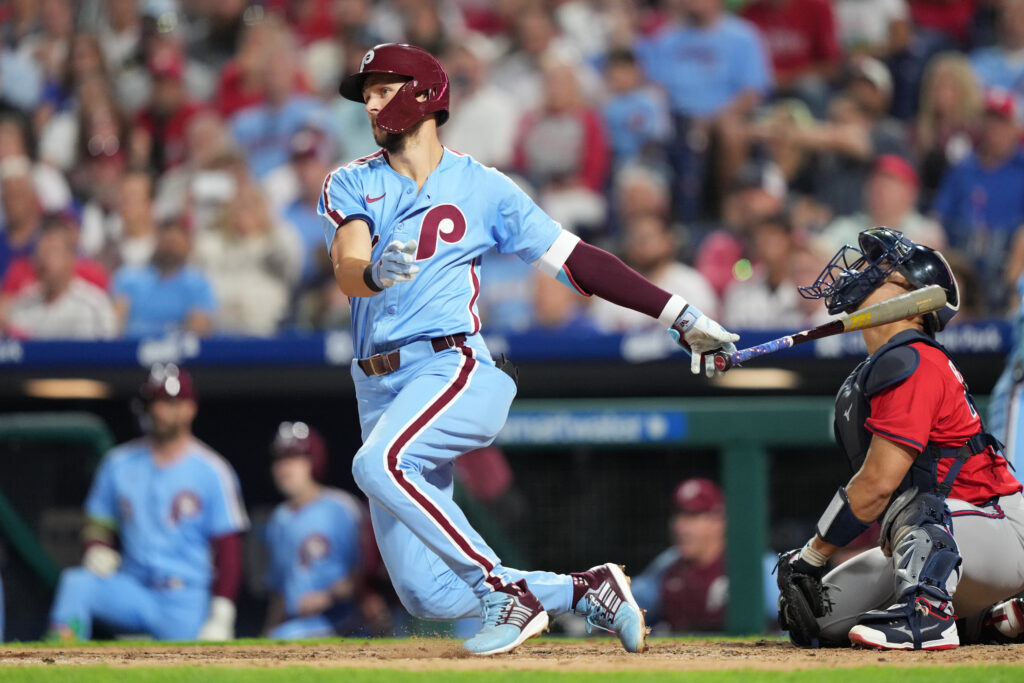
| Philadelphia Phillies | 16 |
| Baltimore Orioles | 16 |
| Texas Rangers | 15 |
| Colorado Rockies | 15 |
| Pittsburgh Pirates | 15 |
| Chicago White Sox | 14 |
| New York Mets | 14 |
| New York Yankees | 13 |
| Houston Astros | 12 |
| Athletics | 11 |
| Los Angeles Angels | 11 |
| Washington Nationals | 10 |
| Minnesota Twins | 9 |
| Seattle Mariners | 9 |
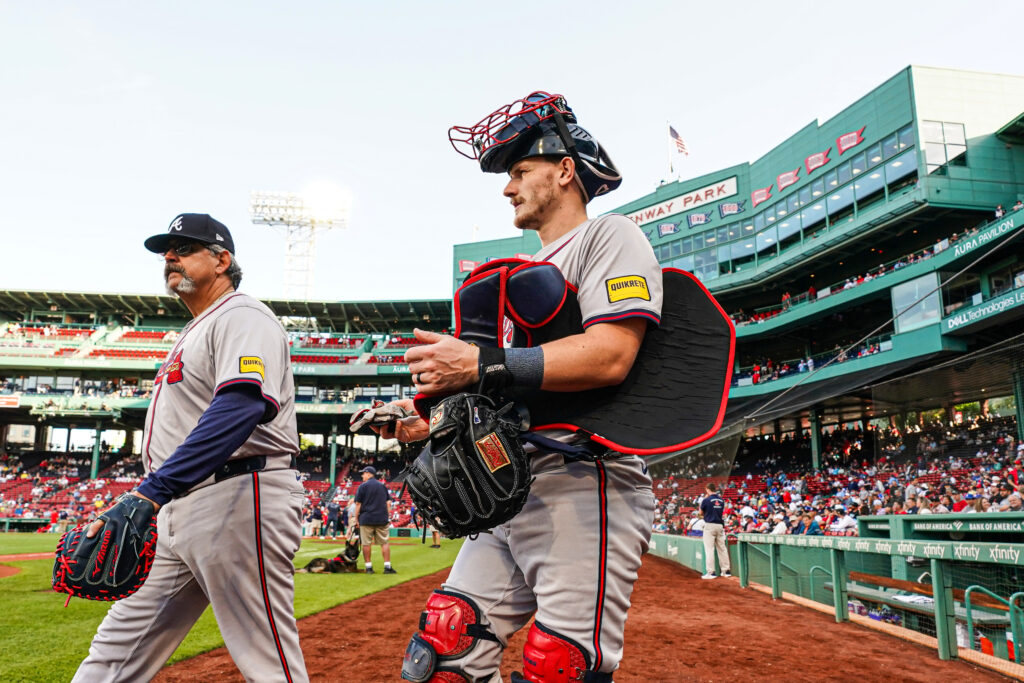
| Atlanta Braves | 5 |
Source: Baseball Savant
But not all advancements are created equal. A runner taking third with no outs increases the run expectancy more than a runner heading to second with two outs. To figure out the value of each advancement, I calculated the run expectancy for each base-out state following the conclusion of the play, then backtracked to calculate what that run expectancy would’ve been had the trail runner not advanced. The delta between those two figures produces a crude run value. Add up all the the run expectancy deltas, and you have something like a run value leaderboard for trail runners alone. Here’s what that looks like:
Trail Runner Runs Gained
| Detroit Tigers | 3.786 |
| St. Louis Cardinals | 3.474 |
| Arizona Diamondbacks | 3.353 |
| Toronto Blue Jays | 3.327 |
| Cincinnati Reds | 3.271 |
| Boston Red Sox | 3.05 |
| Miami Marlins | 3.039 |
| Milwaukee Brewers | 2.934 |
| Kansas City Royals | 2.907 |
| Philadelphia Phillies | 2.898 |
| Chicago Cubs | 2.856 |
| San Diego Padres | 2.739 |
| Tampa Bay Rays | 2.736 |
| Los Angeles Dodgers | 2.609 |
| Baltimore Orioles | 2.317 |
| San Francisco Giants | 2.189 |
| Chicago White Sox | 2.157 |
| New York Mets | 2.035 |
| Cleveland Guardians | 1.981 |
| Pittsburgh Pirates | 1.973 |
| Texas Rangers | 1.948 |
| Houston Astros | 1.875 |
| New York Yankees | 1.774 |
| Colorado Rockies | 1.774 |
| Athletics | 1.429 |
| Washington Nationals | 1.351 |
| Los Angeles Angels | 1.195 |
| Seattle Mariners | 1.023 |
| Minnesota Twins | 0.947 |
| Atlanta Braves | 0.657 |
Source: Baseball Savant
Calculated as delta between post-play base/out run expectancy and run expectancy if trail runner had not advanced.
Perhaps that’s all a little underwhelming. The gap between the Tigers and the Braves — a little over three runs — isn’t especially spectacular. But maybe that’s the wrong lens. In an ideal world, it wouldn’t be a run expectancy delta, but a win expectancy delta. Changes in win expectancy point more to the substance of Kalk’s comments: On a given play and game level, a runner advancing can matter a ton.
Calculating win expectancy changes at the play level is complicated — perhaps a task for the next article — but we can look at one representative example to show the potential impact of a trail runner advancement on win expectancy. In late August, two American League Wild Card contenders were locked in a tight contest. The Rangers were trailing the Guardians by one; the speedy Wyatt Langford stood on second base. On the first pitch, Corey Seager ripped a clean line drive to center field. The Guardians’ center fielder, Angel Martínez, uncorked a huge throw and nearly gunned Langford down at the plate:
If Seager is still standing on first after this throw, the Rangers’ odds of winning this game are 70.8%, according to Tom Tango’s win expectancy spreadsheet. Instead, he wisely tracked the throw (not that tough of a read, ultimately — Martínez launched that thing) and increased his team’s odds of winning by 10 percentage points. With a runner on second and no outs, the Rangers’ odds of winning at this point were 80.7%. Seager scored on the next pitch, jogging home after Joc Pederson scorched a double into the gap.
Curiously, “runs gained from trail runners advancing” does not appear to map onto team sprint speed as neatly as it does to BsR. The r-squared this season between those two variables is just 0.11, a weaker relationship than sprint speed has ever had to BsR during the Statcast era:
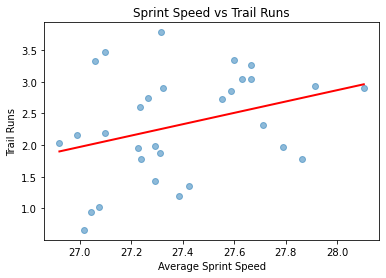
Perhaps this explains why Kalk’s attention is focused on this ostensibly marginal part of the game. It doesn’t take a team of Trea Turners to top the trail runner leaderboards; any team can pick up a couple extra runs over the course of a season — and perhaps even swing the outcome of a few games — with proper attention to these free bases. When competitive edges are few and far between, a penny lying on the sidewalk starts to look like a $20 bill.
![[Underdog] Tylor Megill shut down after feeling arm tightness; will undergo MRI.](https://external-preview.redd.it/fxc78ppMBwzsK7jBF2La3yjGWV_yOO9R2uZQcHe0CuE.jpeg?width=640&crop=smart&auto=webp&s=b379df990cddd3102fd7fac16ee7a6b0eabcaf12)
![[MLB] Jo Adell and Hunter Goodman are your AL and NL Players of the Week presented by @Chevrolet!](https://b.thumbs.redditmedia.com/eVsDqNxxHjWYpuZ2-bP9fvKrZv79YZylfXljL85I4pY.jpg)


 English (US) ·
  French (CA) ·